


Lean Six Sigma Methodology,
the Seven Basic Quality Tools,
Statistical Process Control,
and Root Cause Analysis
Copyright © April 2, 2019 by Robert Wayne Atkins, P.E.
All Rights Reserved.
The following information is Chapter Eleven in my book: Introduction to Industrial and Systems Engineering.
The purpose of a Six Sigma Process Improvement study is to discover how an existing process can be improved to make it more efficient, or improve quality, or reduce the total cost of the process.
A variety of six sigma tools are available that could be used to achieve the objectives of a six sigma process improvement study. In most situations a single six sigma tool is rarely used by itself to improve a process. Instead a combination of six sigma tools is usually required to make a significant improvement in a process.
The key to maximizing the results of a six sigma project, while using the least amount of company resources, and while simultaneously minimizing the amount of wasted effort, is to follow a standard procedure for all six sigma projects. The following procedure is not presented in textbooks or in six sigma seminars. Textbooks and six sigma seminars describe and illustrate how to use all the six sigma tools and then they very carefully explain that judgment is required to select the appropriate tool, or tools, for each project.
A better way to achieve the maximum possible results in the shortest possible time is to apply the six sigma tools in the same sequence to all six sigma projects. The following methodology was developed by the author of this book through experience. The following methodology considers the diversity of six sigma projects, the different objectives of these projects, and what each tool can contribute to the successful completion of a six sigma project.
Eight Step Methodology
for Using the Six Sigma Tools
- The first step should be to construct an Operation Process Chart, a Flow Chart, and a Flow Diagram of the process under review (see chapter 12). This enhances everyone’s understanding of the process from its beginning to its end. This is a critical first step because it familiarizes everyone on the six sigma team with a brief summary of all the activities in the entire process. This has significant benefits to the six sigma team for the following reasons:
- It provides everyone with a clear visual picture of the entire process, including when materials enter the process, what the major work activities are, when and where inspections occur, when delays and storages are encountered, and when major transportations occur. Frequently a process can be significantly enhanced by eliminating unnecessary "delays" and "storages" and by minimizing or eliminating "transportations." This is called "cherry picking" because eliminating delays, storages, and transportations is usually easier to accomplish than changing the way the work is done, or the equipment that is used, or the inspections that are necessary.
- A flow chart provides the team with a glimpse of the "big picture" so that their attention is not exclusively focused on one activity in the overall process. This is important because a process may consist of 20 major activities, and a problem may be identified in activity 16, but the problem could easily be completely eliminated at activity 16 by making a minor change at activity 4. Being able to visual the "big picture" makes this type of creative problem solving much easier to do.
- Being able to clearly see the "big picture" will sometimes allow the team to see deficiencies in the way the process is currently being done. By simply rearranging the sequence of activities, it may be possible that some activities will no longer be necessary and this will result in the overall process requiring less time to complete and this will also reduce the total cost of the process.
- A "revised" flow chart based on the team's recommendations makes it easier for the team to explain the impact of their proposal to management, and this can help management to clearly and easily see the potential benefits of the proposal so that management can approve the team's proposal.
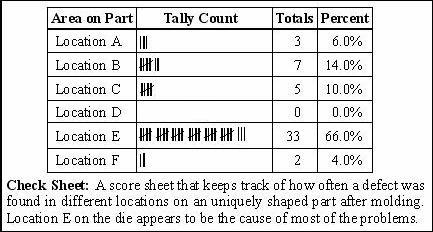
- The second step is to determine the major opportunity for improving the process by using a Check Sheet or a Pareto Chart.
- Check Sheet: Data is collected as it happens and the results are tabulated on a chart. When enough data has been collected the totals and the percent for each group is determined in order to identify the most significant group or category. An illustration a check sheet is on the next page.
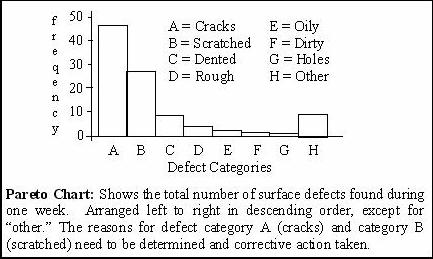
- Pareto Chart: The frequency of occurrence for different problems are shown on a bar chart in descending order of importance from left to right, except for the "other" category. An illustration of a Pareto chart is on the next page.
A careful analysis of the check sheet or the Pareto chart will reveal the problem area that has the greatest potential for improvement. This is a critical second step for the following reasons:
- Most processes have a variety of problems or issues that various people have requested assistance with. These are issues that randomly occur and each one may have a variable impact on the process depending on several different factors. After the team has identified all of these different problems, the team then needs to decide which problem is the most important. This helps the team to focus their attention on the one or two most important problems instead of investing their time on a problem of trivial importance with a trivial financial impact.
- A check sheet or a Pareto chart will not only allow the team to focus its attention on the most important issues, but it can be used to help other people understand why the team is proceeding in a specific direction.
- A check sheet or a Pareto chart that is prepared at the beginning of a six sigma project will provide a future benchmark against which the team can determine the actual impact of the changes they make to the process. A change could have one of three possible impacts: the process could be improved, the process could be made worse, or there may be no change in the process.
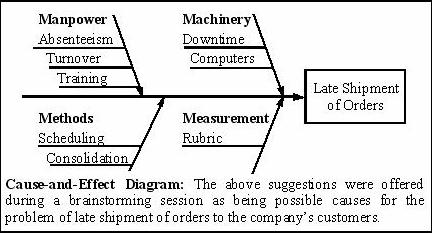
- The third step is to brainstorm different ways on how the major problem identified in step two could be resolved. This is where a Cause-and-Effect Diagram (fishbone diagram) is used. A brief summary of the major problem is written inside a rectangle on the right side of the page, and the potential causes are itemized into logical categories, such as manpower and machinery, on the left side of the page. A brainstorming session is then conducted that solicits input from a team of individuals on the potential causes of the problem. The ideas offered by the team are written on the diagram under one of the categories on the diagram. An example of a cause-and-effect diagram is on the previous page. This is a critical third step in a six sigma project for the following reasons:
- The vast majority of problems have multiple contributing factors. Each factor has some influence on the major problem but the impact of each factor is different. For example, most of the factors may each have an impact of less than 5% on the problem under review, but one of the factors may have an impact of about 30% on the problem and another of the factors may have an impact of about 40% on the problem. However, this will not be obvious from just looking at the diagram.
- The team will need to use their collective judgment to select the one or two most "significant" contributing causes to collect additional information on. This additional data will be collected in step four.
- If the team is correct with its initial assessment, then after they have implemented their proposed changes, the original problem should have been significantly reduced because the major contributing factors have been eliminated (or significantly reduced) and only trivial contributing factors remain. However, if the team is not correct in its initial assessment, then their work may result in a trivial reduction in the original problem and the team will need to return to their original Cause-and-Effect Diagram and select a different factor to investigate.
- If additional data is required on one or more variables that have been identified on the Cause-and-Effect Diagram, then the fourth logical step is to collect data on those variables and create a visual graph of the data. The type of graph will be based on whether one or two variables are to be evaluated.
- If one variable needs to be analyzed by itself, then data should be collected on that variable and a Histogram constructed on that data (see chapter 5). The appearance of the histogram will reveal whether the data appears to be normal or if the data appears to be unusual. The shape of the histogram will usually lead to the analysis described in step five.
- However, if two variables are identified and a cause-effect relationship is believed to exist between these two variables, then data should be simultaneously collected on both variables at the same time, and a Scatter Diagram constructed of that data (see chapter 6). If the scatter diagram suggests the possibility of a cause-effect relationship then a Linear Regression analysis can be done on the two variables (see chapter 6).
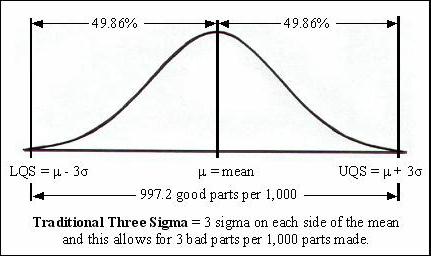
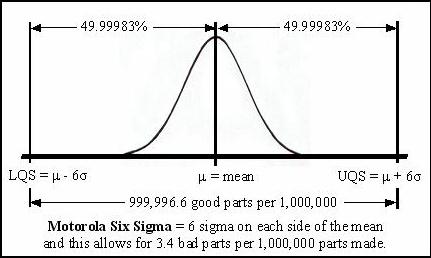
- Statistics may be used to document and analyze the preliminary data in step four (see chapter 5). The average and the standard deviation (sigma) should be calculated and evaluated. For a normal distribution, three standard deviations on each side of the mean will account for 99.7% of all the variability in the process under review. In the year 1986 Bill Smith began working on a project at Motorola to reduce the standard deviation and improve quality. On December 28, 1993 Motorola filed for a trademark on "Six Sigma." Six Sigma means there are six standard deviations between the mean and the upper specification limit of the process, and six standard deviations between the mean and the lower specification limit of the process. This reduces the number of bad parts to 3.4 per million. Motorola’s proposal received wide-spread publicity in the quality media, and it became known as a Motorola Six Sigma Process. It is easy to discuss and describe a six sigma process. However, it is extremely challenging to create a six sigma process except in a few special situations. Most companies are content to make good progress towards a six sigma process because the cost of actually achieving a true six sigma process of 3.4 bad parts per million could make the price of their products too expensive and they would go out of business. Therefore, companies that require almost perfect products have found it is more cost effective to 100% inspect each of their products several times instead of trying to make products that are almost perfect.
- If the analysis of the data in step five indicates that there is a problem with the consistency (sigma) of the data, then the most logical place to begin looking for potential problems is the quality of the incoming raw materials associated with that data. An appropriate Acceptance Sampling plan (see chapter 9) should be in use at the receiving dock to verify the quality of purchased parts. A careful analysis should be made of the suitability of that acceptance sampling plan. A change in the acceptance sampling plan may result in a significant improvement in the consistency of the parts released to manufacturing, and this may eliminate or significantly reduce the original problem identified in steps two and three.
- If the quality of the incoming purchased parts is acceptable, then the next place to look is the actual process where the original problem was identified. A Control Chart (see chapter 10) can be constructed on the process and when the process generates an out-of-control data value, then the process can be immediately investigated to determine the cause of the variation. Corrective action can then be taken to resolve the reason for the variation. It may be possible to revise the operating procedures at the process to prevent that particular problem from reoccurring again in the future.
- After resolving the above issues the company will usually wish to know something about the Reliability of its product, or how long the product will work properly after it has been purchased by the company’s customers. A reliability study could then be conducted on the product (see chapter 7).
Lean Manufacturing
Another method of improving a company's operations is to use Lean Manufacturing strategies. These strategies are very similar to the traditional industrial engineering process improvement concepts that were developed in the early 1900s. However, these concepts have been slightly rearranged and reworded and they are now more commonly know as lean manufacturing strategies.
Lean manufacturing's primary objective is to do more using fewer resources. Lean manufacturing accomplishes this primary objective by pursuing the following goals:
Identify and eliminate all activities that do not add value.
Improve utilization of existing resources.
Eliminate waste.
Simplify processes.
Reduce the time required to produce the product or deliver the service.
Lean Manufacturing Strategies
- Eliminate non-value activities (known as "cherry picking" in chapter 12). Non-value activities include the following:
- Minimize or eliminate delays in the process.
- Minimize the total number of transportations.
- Minimize the number of storages in the process.
- Eliminate excess unnecessary inventory (chapter 16). However, remember that inventory is an asset and inventory has significant advantages. But inventory carrying costs are an expense, such as property tax and fire insurance. It is important to keep these concepts separate because inventory has value. A reasonable level of inventory helps to reduce the overhead costs of operating the facility, such as overtime costs and equipment downtime costs.
Use the takt time to achieve the optimal process time (chapter 17).
- Improve quality and eliminate defects. This can be accomplished by strategically designing the appropriate acceptance sampling plan for each purchased part (chapter 9), and by monitoring the company’s manufacturing operations using the appropriate control chart at each process (chapter 10).
- Utilize motion economy principles and optimize all the employee operations (chapter 13). This is most efficiently done by utilizing the talents of an industrial and systems engineer.
- Minimize the setup times on equipment. This can be accomplished by having a standard setup procedure for each piece of equipment, and by processing the optimal number of parts on the equipment before changing the equipment over to process a different part, and by scheduling parts through the equipment that require the minimum setup changes from the previous part to the next part.
- Adopt a "pull" system in manufacturing using the kanban concept. Kanbans can be physical storage containers or they can be dedicated spaces on the floor of the production facility (chapter 17).
- Implement preventive maintenance instead of waiting for equipment to breakdown. Most equipment manufacturers have recommended preventive maintenance procedures for the equipment they sell. Implement those procedures using a checklist that is maintained at the equipment, or in a computer, that indicates when the procedure was last done and when it should next be done.
- Utilize the creative ideas of all the employees of the company. Give credit to the employees whose suggestions are implemented.
The 5 Why's
Determine the root cause of a problem by asking "Why?" five (or more) consecutive times until the real reason is identified.
The Five S's
- Simplify (Seiri): Simplify or streamline each individual work area by removing all unnecessary items.
- Straighten (Seiton): Use the traditional industrial engineering motion economy principles to rearrange the work area to maximize employee productivity (chapter 13).
- Scrub (Seiso): Keep the work area clean and organized.
- Standardize (Seiketsu): Create a standard best method for each operation and then have employees follow that method. This best method is normally designed by an industrial engineer (chapter 13).
- Sustain (Shitsuke): Never be satisfied with your current results. Continue to look for new ways to improve and further optimize every process.
Should Incoming Inspection Be Eliminated?
Sometimes the following suggestion will be made: since the seller inspects the parts before shipping the parts to the buyer, the parts must be good quality parts and incoming inspection at the buyer’s location can be eliminated because it is a duplication of the work done at the seller’s location, and therefore it is a non-value added activity.
The above suggestion is flawed for two reasons:
- The seller may make a mistake in evaluating the quality of the parts he makes and he may accidentally ship some bad parts to the buyer.
- The buyer may have a different perspective on the quality of the parts because the parts can seriously impact the buyer’s operations.
Therefore instead of 100% eliminating incoming inspection a more logical strategy would be to minimize incoming inspection. This can be achieved by doing significantly less inspection on those sellers who have consistently shipped good quality parts in the past. However, sellers who do not have this type of history should still have their parts inspected using a standard incoming acceptance sampling procedure.
The Seven Basic Quality Tools
When companies in the USA decided that they needed to train their employees in the basic concepts of quality, they combined the seven most commonly used quality tools into one quality training course. This provided the employees of a company with training in the basic quality tools that could be used to improve quality. Each of the tools was presented as a quality technique that an employee could use if the employee believed it would be of benefit in improving quality at the process the employee was examining. The seven tools are as follows:
- Flow Chart, or Run Chart, or Stratified Sampling: Originally a flow chart was one of the seven basic tools. However, as time passed some organizations decided that a different tool would be more useful to their employees. Since the number of basic tools had already been fixed at seven, the most logical way to include a new different tool was to replace the tool that the organization felt was of less importance to their employees, such as a flow chart.
- A flow chart shows the activities or steps required to complete a process in the proper sequence from beginning to end. This technique is discussed in detail in chapter 12.
- A run chart shows data on a chart in relation to time. The points on the chart are connected together in order to visually display any patterns that might be present.
- Stratified sampling is a method for selecting samples from a population so the sample approximates the characteristics of the population. The population is segmented into homogenous subgroups based on a specific characteristic and the percentage in each subgroup is determined. A sample is then selected so that the percent in each subgroup in the sample matches the percent in the population.
- Check Sheet: Discussed at the beginning of this chapter.
- Pareto Chart: Discussed at the beginning of this chapter.
- Cause-and-Effect Diagram: Discussed at the beginning of this chapter.
- Histogram: Discussed in detail in chapter 5.
- Scatter Diagram: Discussed in detail in chapter 6.
- Control Chart: Discussed in detail in chapter 10.
The employees of a company are usually trained in how to properly use each of the seven basic quality tools. Then they are told to use their own judgment on when to use each tool. A better training method would be to explain how the seven tools are part of the lean six sigma methodology explained at the beginning of this chapter so each employee can understand the purpose of each tool and when to use it.
Statistical Process Control
The basic objective of statistical process control is to determine and implement the appropriate statistical procedures throughout a facility in order to improve the quality of the company’s products. Statistical process control is identical to the first seven steps described in the Six Sigma methodology described at the beginning of this chapter.
Root Cause Analysis
The basic objective of root cause analysis is to find the primary reason or reasons for a specific quality problem and then take corrective action to eliminate or reduce that problem. Root cause analysis involves the first seven steps in the Six Sigma methodology described at the beginning of this chapter.
Kaisen Event
The Japanese word "kaisen" means improvement. A "kaisen event" is the same thing as a lean six sigma process improvement study.
Chapter Summary
This chapter discusses lean six sigma, the seven basic quality tools, statistical process control, root cause analysis, and kaisen events. The purpose of this chapter was to show how these five concepts are all very similar, and that they are not five different methods for improving quality.
Click here to read more information about the book: "Introduction to Industrial and Systems Engineering."
Grandpappy's e-mail address is: RobertWayneAtkins@hotmail.com